Story: LiDAR and AI towards high-throughput phenotyping of wheat
Description: In this data story, we will walk you through our experience of employing aerial photography and AI to achieve high-throughput phenotyping (HTP) of wheat, allowing breeders to examine crop traits in large-scale field studies, without using manual destructive methods. We leverage LiDAR data obtained from drones to calculate plant height and use a forecasting model to predict future growth, analysing the trends in crop height during the whole wheat growth cycle.
Collaboration with: Agricultural Research Institute (Andreas Pallides, Angelos Kyratzis)
Project: PHENOWEX
Techniques used: Geospatial analysis, data visualization, predictive models and computer vision (Noor Sajjad)
Data story:
The Background: Agriculture plays a critical role in the Cypriot economy. With an increase in demand over the past few decades, researchers and agronomists have been working on ways to improve food security. Emerging remote sensing technology enables high-throughput phenotyping (HTP) on a large scale, allowing breeders to examine crop traits without using manual destructive methods. The combination of aerial photography and AI, for precise HTP has opened up new possibilities for advancement in this field. In this data story, we explore how we can automate the process for selective breeding at the field, by means of drones and AI techniques. While drones can use LiDAR technology to calculate plant height, AI algorithms can analyse and interpret large datasets and extract meaningful patterns and correlations between phenotypic traits and genetic factors [1].
The Importance: The height of the wheat plant is a key indicator of a genotype’s physical trait, which demonstrates how the plant is reacting to its surroundings, including water and nutrient availability, and competition for light. Sufficient water and nutrient intake results in elongated plants with strong stem structure, increased leaf expansion, which enhance biomass. An abnormal increase in height of the plant may result in bending or breaking of the stem, known as the logging effect, causing a reduction in yield. Tall varieties of wheat (≥120 cm) are especially prone to lodging, making height management important in breeding and crop management [2]. Sudden elongation of the plants indicates competition for light, while shorter plants indicate stress. Height estimation enables agronomists to monitor predictive features of the crop, such as tilling and flowering stages.
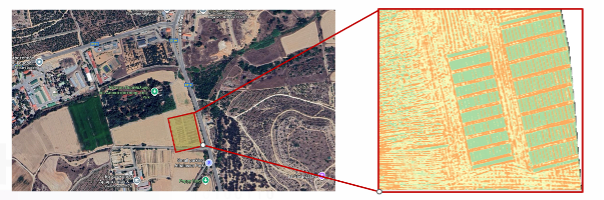
The Experiment: This experiment was carried out in Athalassa, Aglantzia, Nicosia (35°08'14"N 33°24'14"E) in collaboration with Agricultural Research Institute, in a collaboration between the PHENOWEX and PHENOTYPOS research projects. The experimental plot is shown in Figure 1.
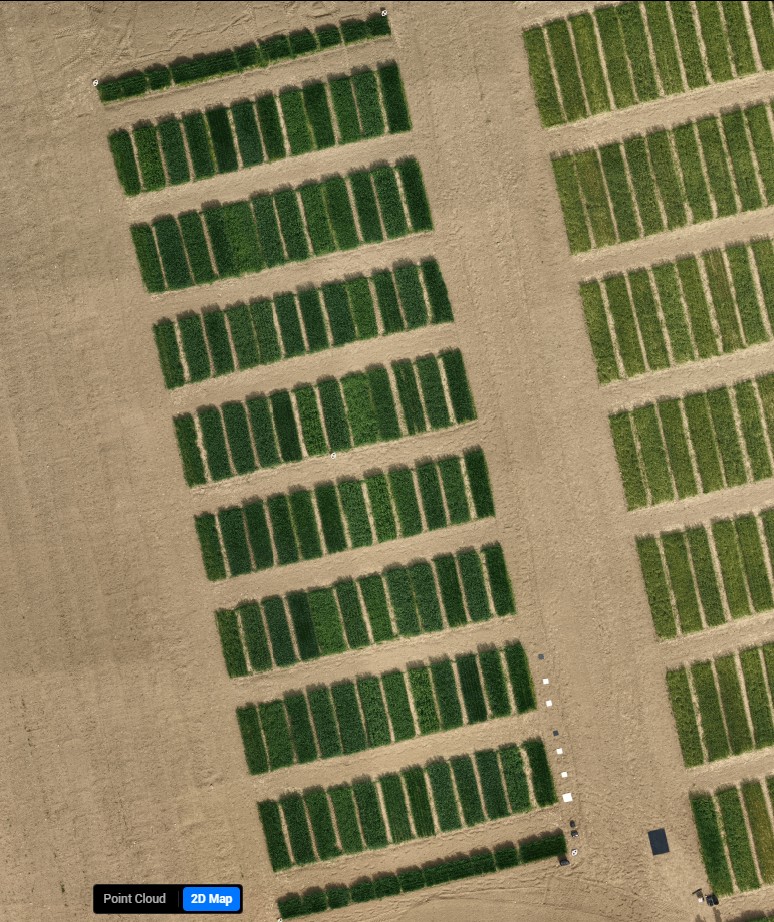
LiDAR was used to evaluate the height of different wheat varieties. Our experimental plot consists of 20 genotypes of two different varieties of wheat, which are wheat (Triticum aestivum) and durum wheat (Triticum turgidum durum). These two varieties had 10 genotypes each, and every genotype consisted of 4 replications, which gives us 80 mini plots in total. Figure 2 illustrates the layout of the 80 experimental mini plots, while smaller plots on the borders were created to minimise the border effect.
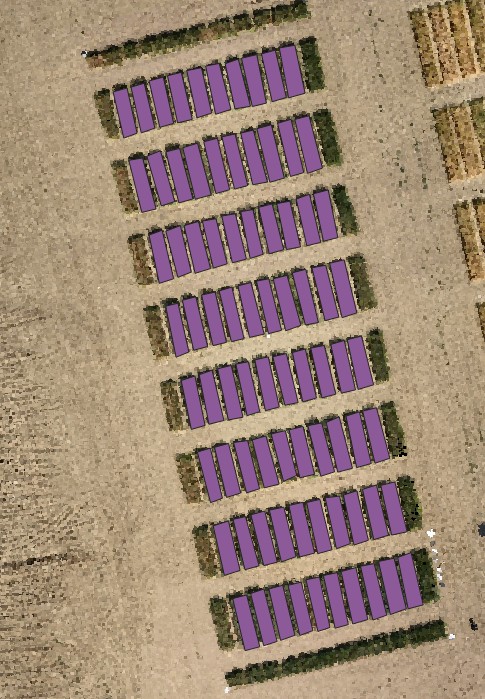
Canopy height calculation: Data acquisition was done by mounting the LiDAR sensor ZenMuse L2 on the DJI Matrice 350 RTK platform to capture 3D point cloud data over a period of 6 weeks, between February 2025 and April 2025. For analysis, we used DJI Terra to generate the orthomosaic of the captured data. Geospatial processing was done in QGIS. We leveraged its capabilities to generate precise feature masks and then systematically label each phenotype as shown in Figure 3.
To extract height, we used a common geospatial modelling approach [3]:
Canopy Height Model = Digital Surface Model – Digital Elevation Model
We employed multiple methods for data cleaning and stabilization to ensure that our calculated heights are free from sensor errors: we used isolation forest, a machine learning model which detects anomalies based on neighbouring values. Occasionally, reflections from the ground are also included in the elevation layer as noise points. To remove these points, we applied both upper and lower threshold to mitigate this issue. In the final step of data cleaning, we used the 95th percentile(p95) for the height of each mini plot [3]. This gives us robust and reliable heights for each plot.
Visualizing growth: To compare the growth rate across every mini plot, we first compared the p95 percentile of each, which shows that the height of each variety varies based on its genomic structure, since all were provided with the same environmental conditions. Figure 4 demonstrates the p95 percentile height at Week 3.
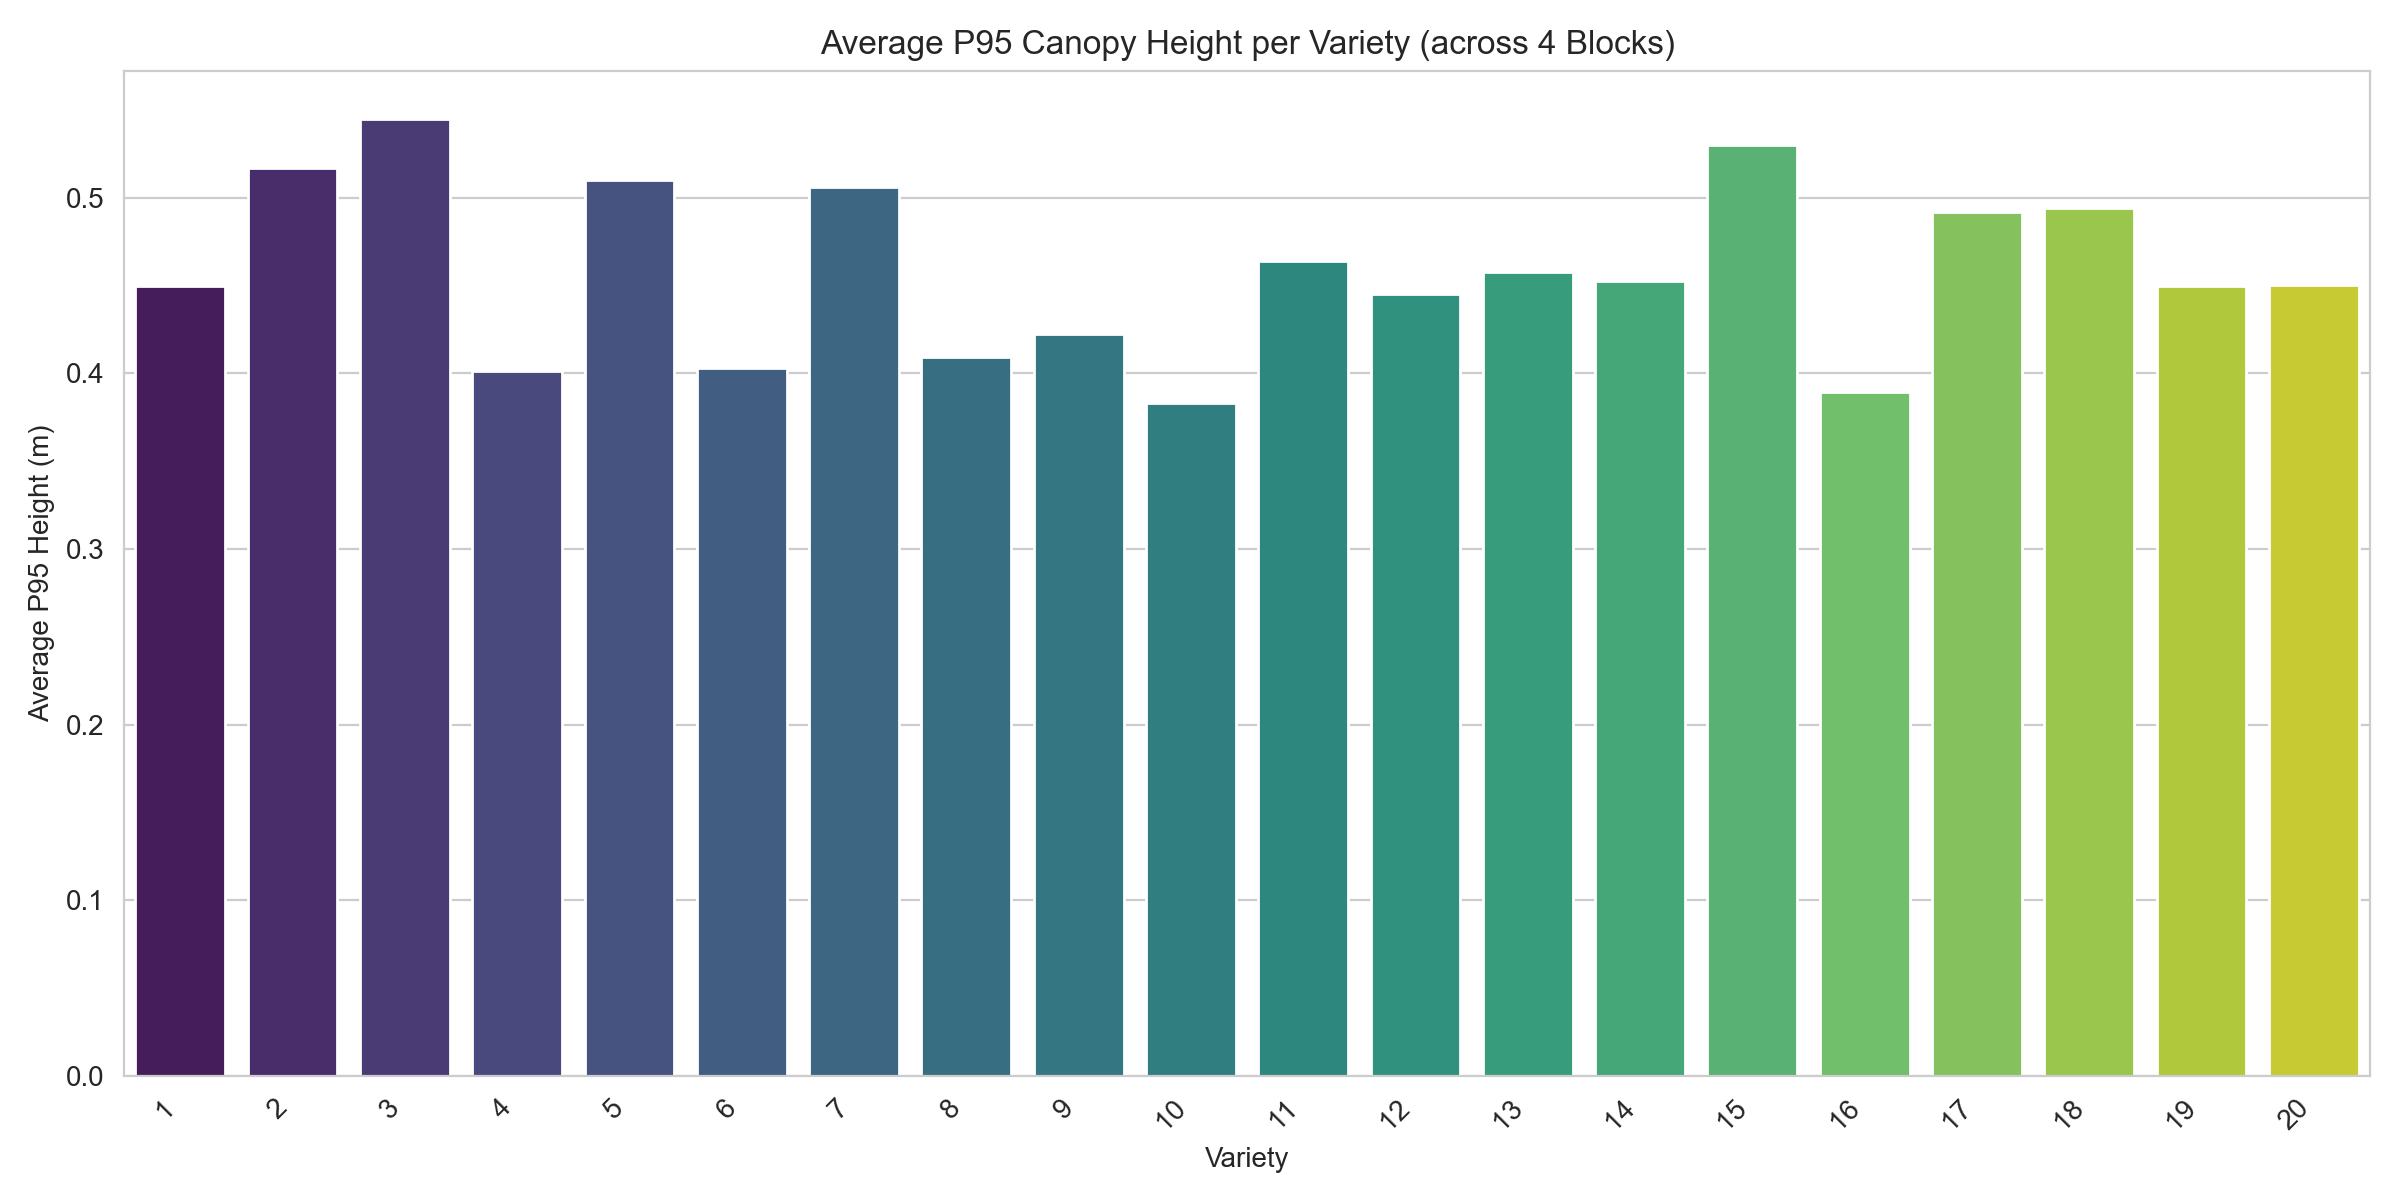
For capturing the trends over the entire growth cycle, we calculate the average of each replication and compare them for the whole cycle, as illustrated in the heatmap of Figure 5, where only the 20 genotypes are visualized.
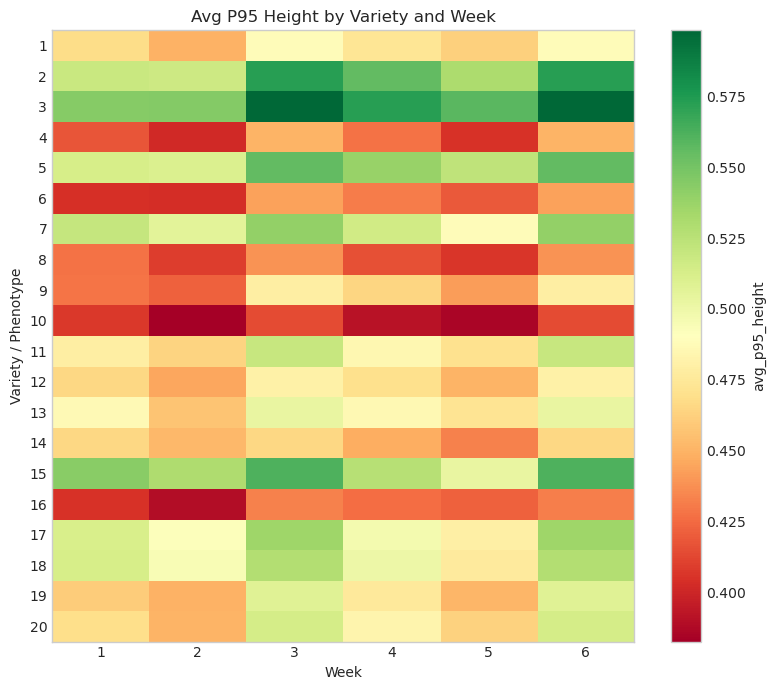
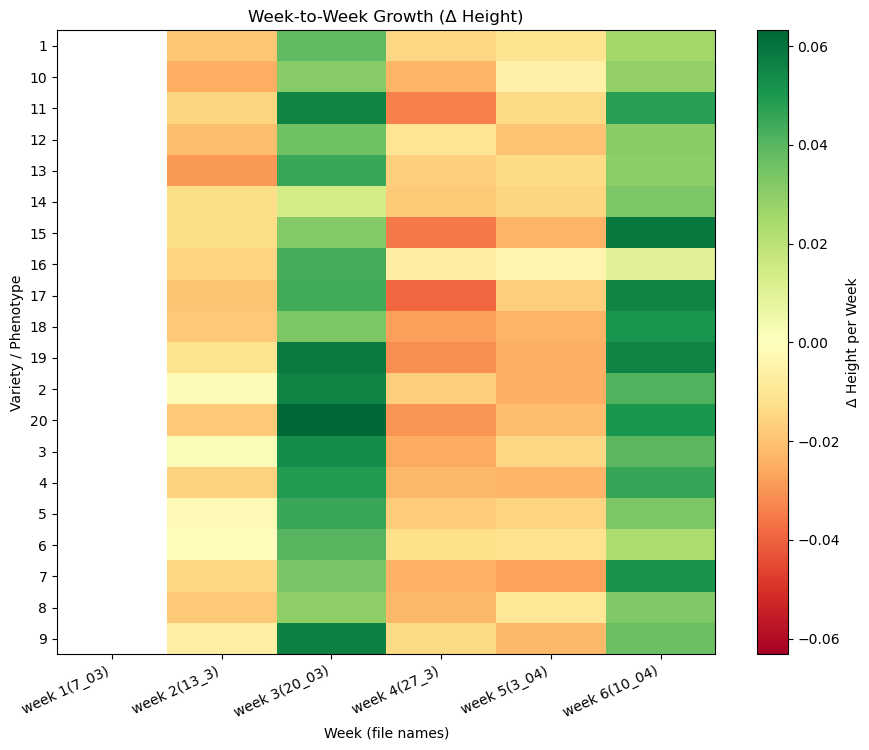
This growth trend tells us the story of each variety. Most growth occurred during Week 3, when the field had the most suitable circumstances. During that week, there was a significant increase in the temperature, which resulted in boosting growth rate, as compared to other weeks. The growth rate change per week is illustrated in Figure 6. Our results clearly demonstrate significant growth of wheat in Week 3 and Week 6.
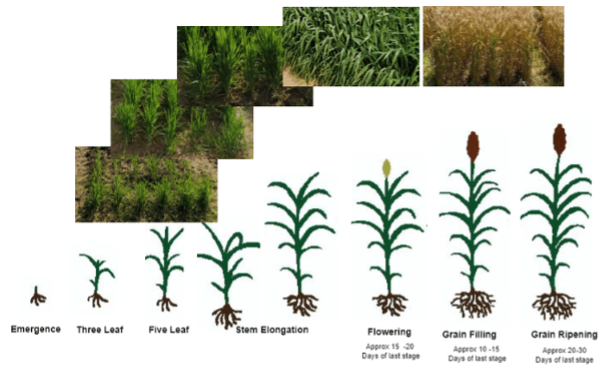
These results aligns with the theoretical growth cycle of wheat, illustrated in Figure 7, which is in alignment with our field results.
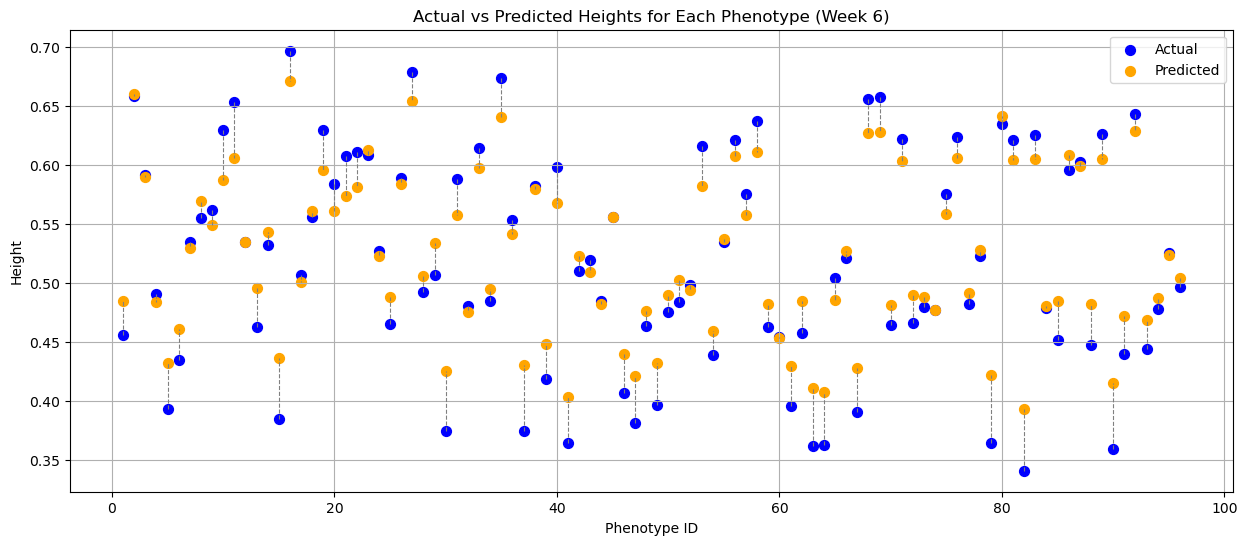
Predicting height: Height forecasting is an important contribution of this work. To implement this, we developed an AI model which predict the height of each wheat mini plot at the next week, based on the data collected in the previous weeks. In other words, the AI model learns based on the previous growth trend and predicts the future height. Our model returned promising results with an MAE of 0.015, which is translated as 1.5cm error from the wheat plant’s actual height, an R2 Score of 0.96, and RMSE of 0.0183. Figure 8 shows the predicted (yellow colour) vs. actual values (blue color) of all the 80 mini plots at Week 6. The figure indicates the good predictability of our model. This is significant, considering the small number of examples (80 mini plots, 5 weeks), available for the AI model to learn the problem, before predicting the height at the 6th week. Comparing with scientific literature, our results can be considered state-of-the-art.
References:
[1] Sheikh, M., Iqra, F., Ambreen, H., Pravin, K. A., Ikra, M., & Chung, Y. S. (2024). Integrating artificial intelligence and high-throughput phenotyping for crop improvement. Journal of Integrative Agriculture, 23(6), 1787-1802.
[2] Mondal, T. (2020). Lodging in wheat: Its causes, ill effects and management for higher productivity and profitability. Indian Farmer, 7(09), 832-837.
[3] Kuipanich, N., Worachairungreung, M., Waiyasusri, K., Sae-Ngow, P., & Pinasu, D. (2022). Height measurement and oil palm yield prediction using unmanned aerial vehicle (UAV) data to create canopy height model (CHM). Geographia Technica, 17(2).