Story: A novel method for mapping the UHI Effect - The Nicosia case study
Description: In this data story, we will walk you through our experience of characterizing the urban heat island (UHI) effect at the city of Nicosia, Cyprus, through a pioneering hybrid methodology combining climate physics and deep learning maps. For two months last summer, Nicosia's municipal trucks carried more than just their crews. Mounted to their roofs were equipment recording the city's temperature, second by second, as the trucks went about their normal routes. By September, that equipment had collected nearly 700,000 measurements and an AI model trained on them now lets us see, hour by hour and street by street, where Nicosia is hottest. The most surprising finding is not that the city is warmer than the countryside, but when it is warmer. In the late afternoon and evening, Nicosia's centre runs roughly 2.5–3 °C hotter than the rural plains around it. But in the morning, much of the city is actually cooler than its surroundings, shaded by its own buildings. And during August's record-breaking heatwave, the urban–rural gap almost vanished, indicating that the most dangerous heat days are not always the most extreme ones. More technical details about the study are provided here.
Collaboration with: Nicosia Municipality (Charis Theocharous, Olivia Skordi), Atmosphere and Climate Research Centre (CARE-C) of the Cyprus Institute (Panos Hadjinicolaou)
Project: CLIMAAX-NIC
Techniques used: AI/computer vision, geospatial analysis, data visualization, predictive modeling (Savvas Karatsiolis & Chirag Padubidri)
Data story:
The Background: Urban areas alter the local surface energy balance due to the replacement of natural land cover with impervious materials, the emission of anthropogenic heat and the reduction of evapotranspiration. The resulting temperature excess of cities relative to their rural surroundings (UHI) is one of the most thoroughly documented manifestations of urbanization. At the global scale, the magnitude of UHI has been shown to depend in a nonlinear way on background climate and city size, with arid and semi-arid regions often exhibiting particularly strong signals. The implications of these dynamics are particularly relevant in the Mediterranean and Middle East North Africa (MENA) region.
The Importance: Traditional approaches rely on sparse weather stations or satellite surface temperatures that do not reflect human-experienced heat. Our approach bridges the gap by estimating air temperature at human height, at high spatial and temporal resolution. Our findings are particularly relevant in the MENA region, where regional warming and urban expansion are increasing the need for local-scale, sub-daily monitoring of urban heat. The proposed framework provides an interpretable basis for such monitoring and may support future evaluation of mitigation measures such as greening interventions or cool-material deployment.
The Method: We approach UHIE modeling by decoupling the capacity of an area to exhibit a UHIE of a certain strength from the phenomenon excitation by ambient conditions. The study introduces a framework for modelling the UHI by decomposing the observed urban rural temperature difference into a location-specific potential component (UHIp) and a weather-driven modulation component (UHIm), coupled through a multiplicative interaction. This structure bridges physically-based urban canopy schemes, which require detailed three-dimensional morphology, and purely data-driven approaches, which are often difficult to interpret.
The AI model integrates the UHI effect potential and its modulation with wind correction to compute the temperature difference between the 200 m cells and the reference temperature at a given time. The model's inputs include: the cell ID (an integer ranging from 0 to the maximum location index), the reference environmental parameters (temperature, humidity, wind speed at 2 m and 10 m above ground, wind direction, atmospheric pressure, and solar irradiance), as well as the wind speed and altitude measured by the vehicle-mounted device. As the UHI effect varies with both the time of day and the season, the model is also provided with the date and time of each measurement.
The Data: A vehicle-mounted device (see Figure 1) was developed to collect spatially resolved temperature and wind speed measurements during real-world driving. The system records geographic position and auxiliary contextual variables simultaneously. All sensing, processing, and storage functions are integrated into a compact, self-contained unit suitable for extended mobile operation. Conducting environmental measurements from a moving vehicle poses several challenges, including aerodynamic disturbances and radiative heating effects. The systematic biases introduced by these effects are negligible in stationary measurements but become significant under mobile conditions. Therefore, the system emphasizes physical separation between sensors and heat-generating components, controlled exposure to ambient airflow, and consideration of air speed caused by car movement. Devices were mounted on the vehicles of the Nicosia Municipality (see Figure 2).

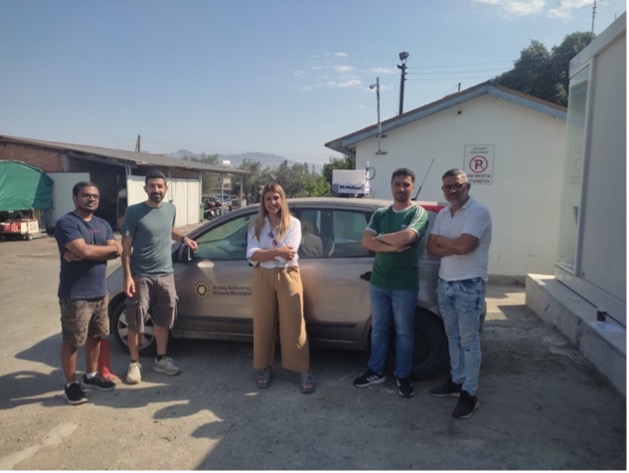
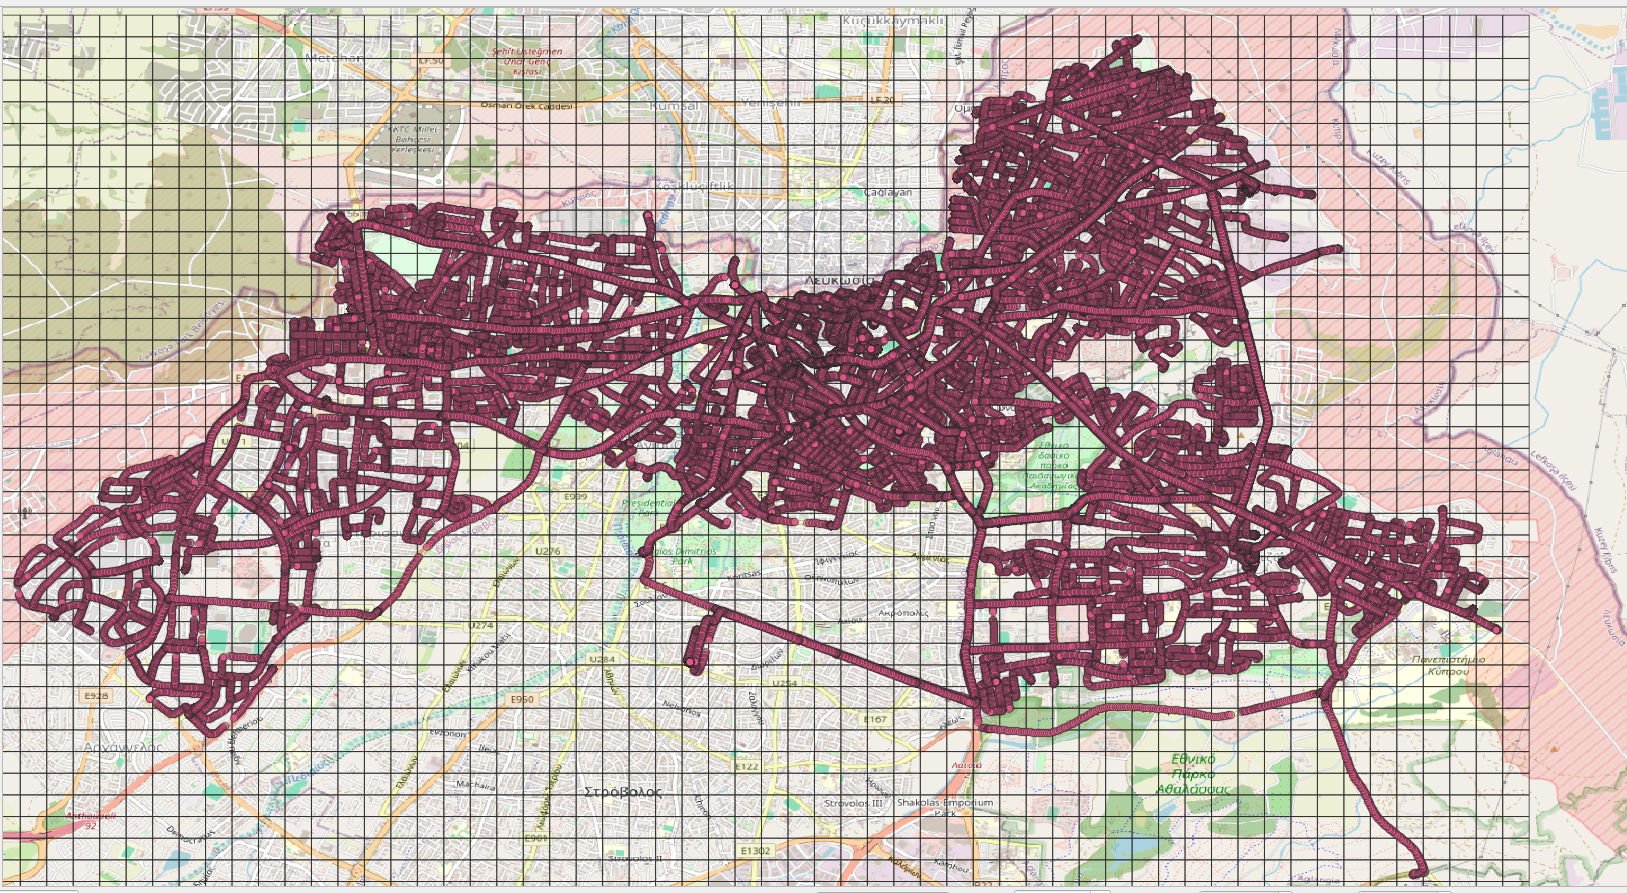
We developed two vehicle-mounted systems to support conducting two independent missions each day throughout August and September: one during the morning to early evening hours (08:00 - 15:00) and one during the evening to nighttime hours (18:00 23:30). The car routes were not explicitly planned for data acquisition but traversed the city opportunistically in accordance with the Municipality crew's duties, i.e., the employees performed their regular duties while simultaneously collecting the data. Therefore, they had to mount the devices on the car roof before their shift started, remove them at the end of their shift and charge the equipment batteries when necessary. The data acquisition phase produced a database containing approximately 700,000 data points, based on a 1-second acquisition interval. Figure 3 shows the map of the acquired data throughout the measurements' acquisition phase.
The Results: We constructed a UHI heatmap for the city of Nicosia, by averaging the computed UHIp values over certain day intervals at each location. This heatmap (for the month of August) is illustrated in Figure 4, allowing to clearly identify the hotspots of the UHI effect across the city, based on the modelling of 200x200 meters cells we divided the geographical area of the city. Notably, this UHIp heatmap shows the potential for areas to experience temperatures different from those in rural areas. The reader can explore the UHI potential of the city of Nicosia for a specific month, date and time at the web app we developed.
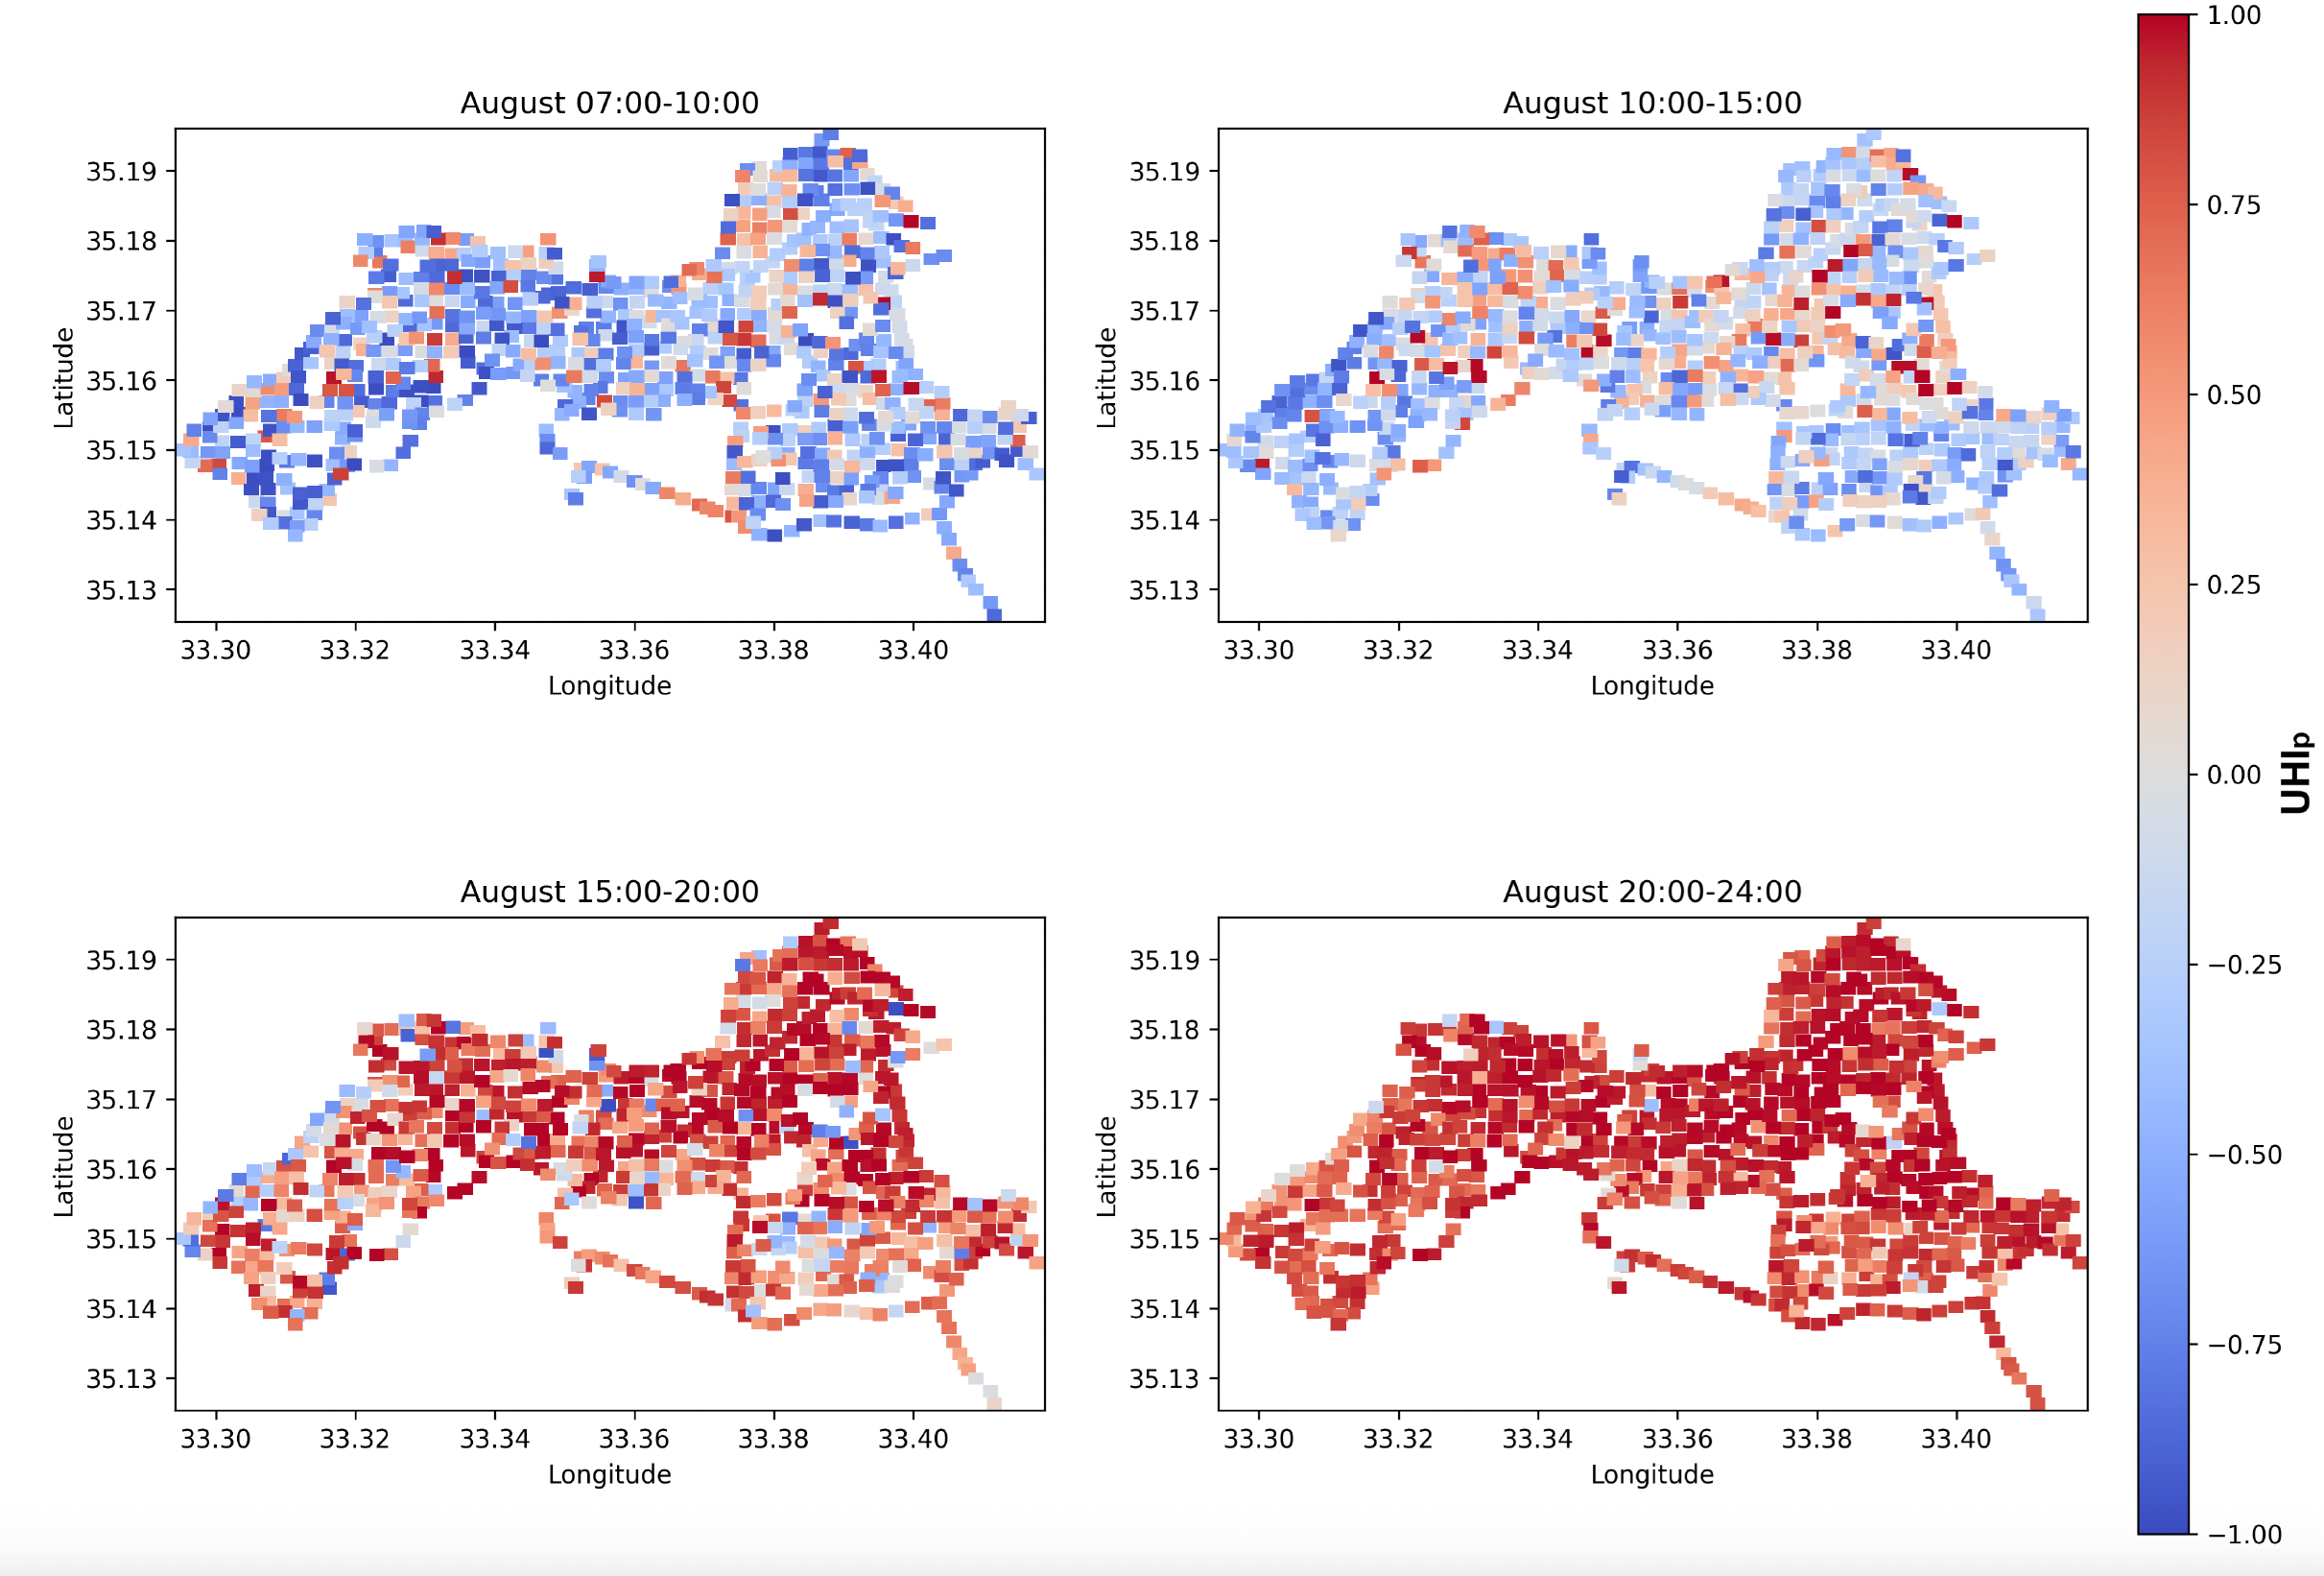
In the morning hours (07:00 - 10:00), UHIp is predominantly negative (blue tones) across most of the city, indicating a widespread urban cool-island regime driven by the thermal inertia of built surfaces still releasing the previous night's cooling and enhanced by street-canyon shading. As solar forcing intensifies through the midday interval (10:00 - 15:00), cool-island cells retreat and warm clusters (orange-red tones) begin to emerge, particularly in the denser central and north-eastern districts. By the afternoon-to-evening interval (15:00 - 20:00), the pattern inverts to a near-city-wide heat-island, with deep red tones dominating and the nocturnal maps (20:00 - 24:00) show the highest and most spatially coherent positive UHIp values. The temporal-averaged UHI signatures of the city are depicted in Figure 5, showing the typical variation of UHI potential throughout the hours of the day. A rapid transition from negative to positive UHI potential occurs between approximately 12:00 and 16:00 during August. This transition indicates the point at which the cumulative absorption of solar radiation by urban fabric begins to raise canopy-layer temperatures above those of the surrounding rural landscape. The steepness of this variation reflects the large difference in thermal inertia between urban and rural surfaces.
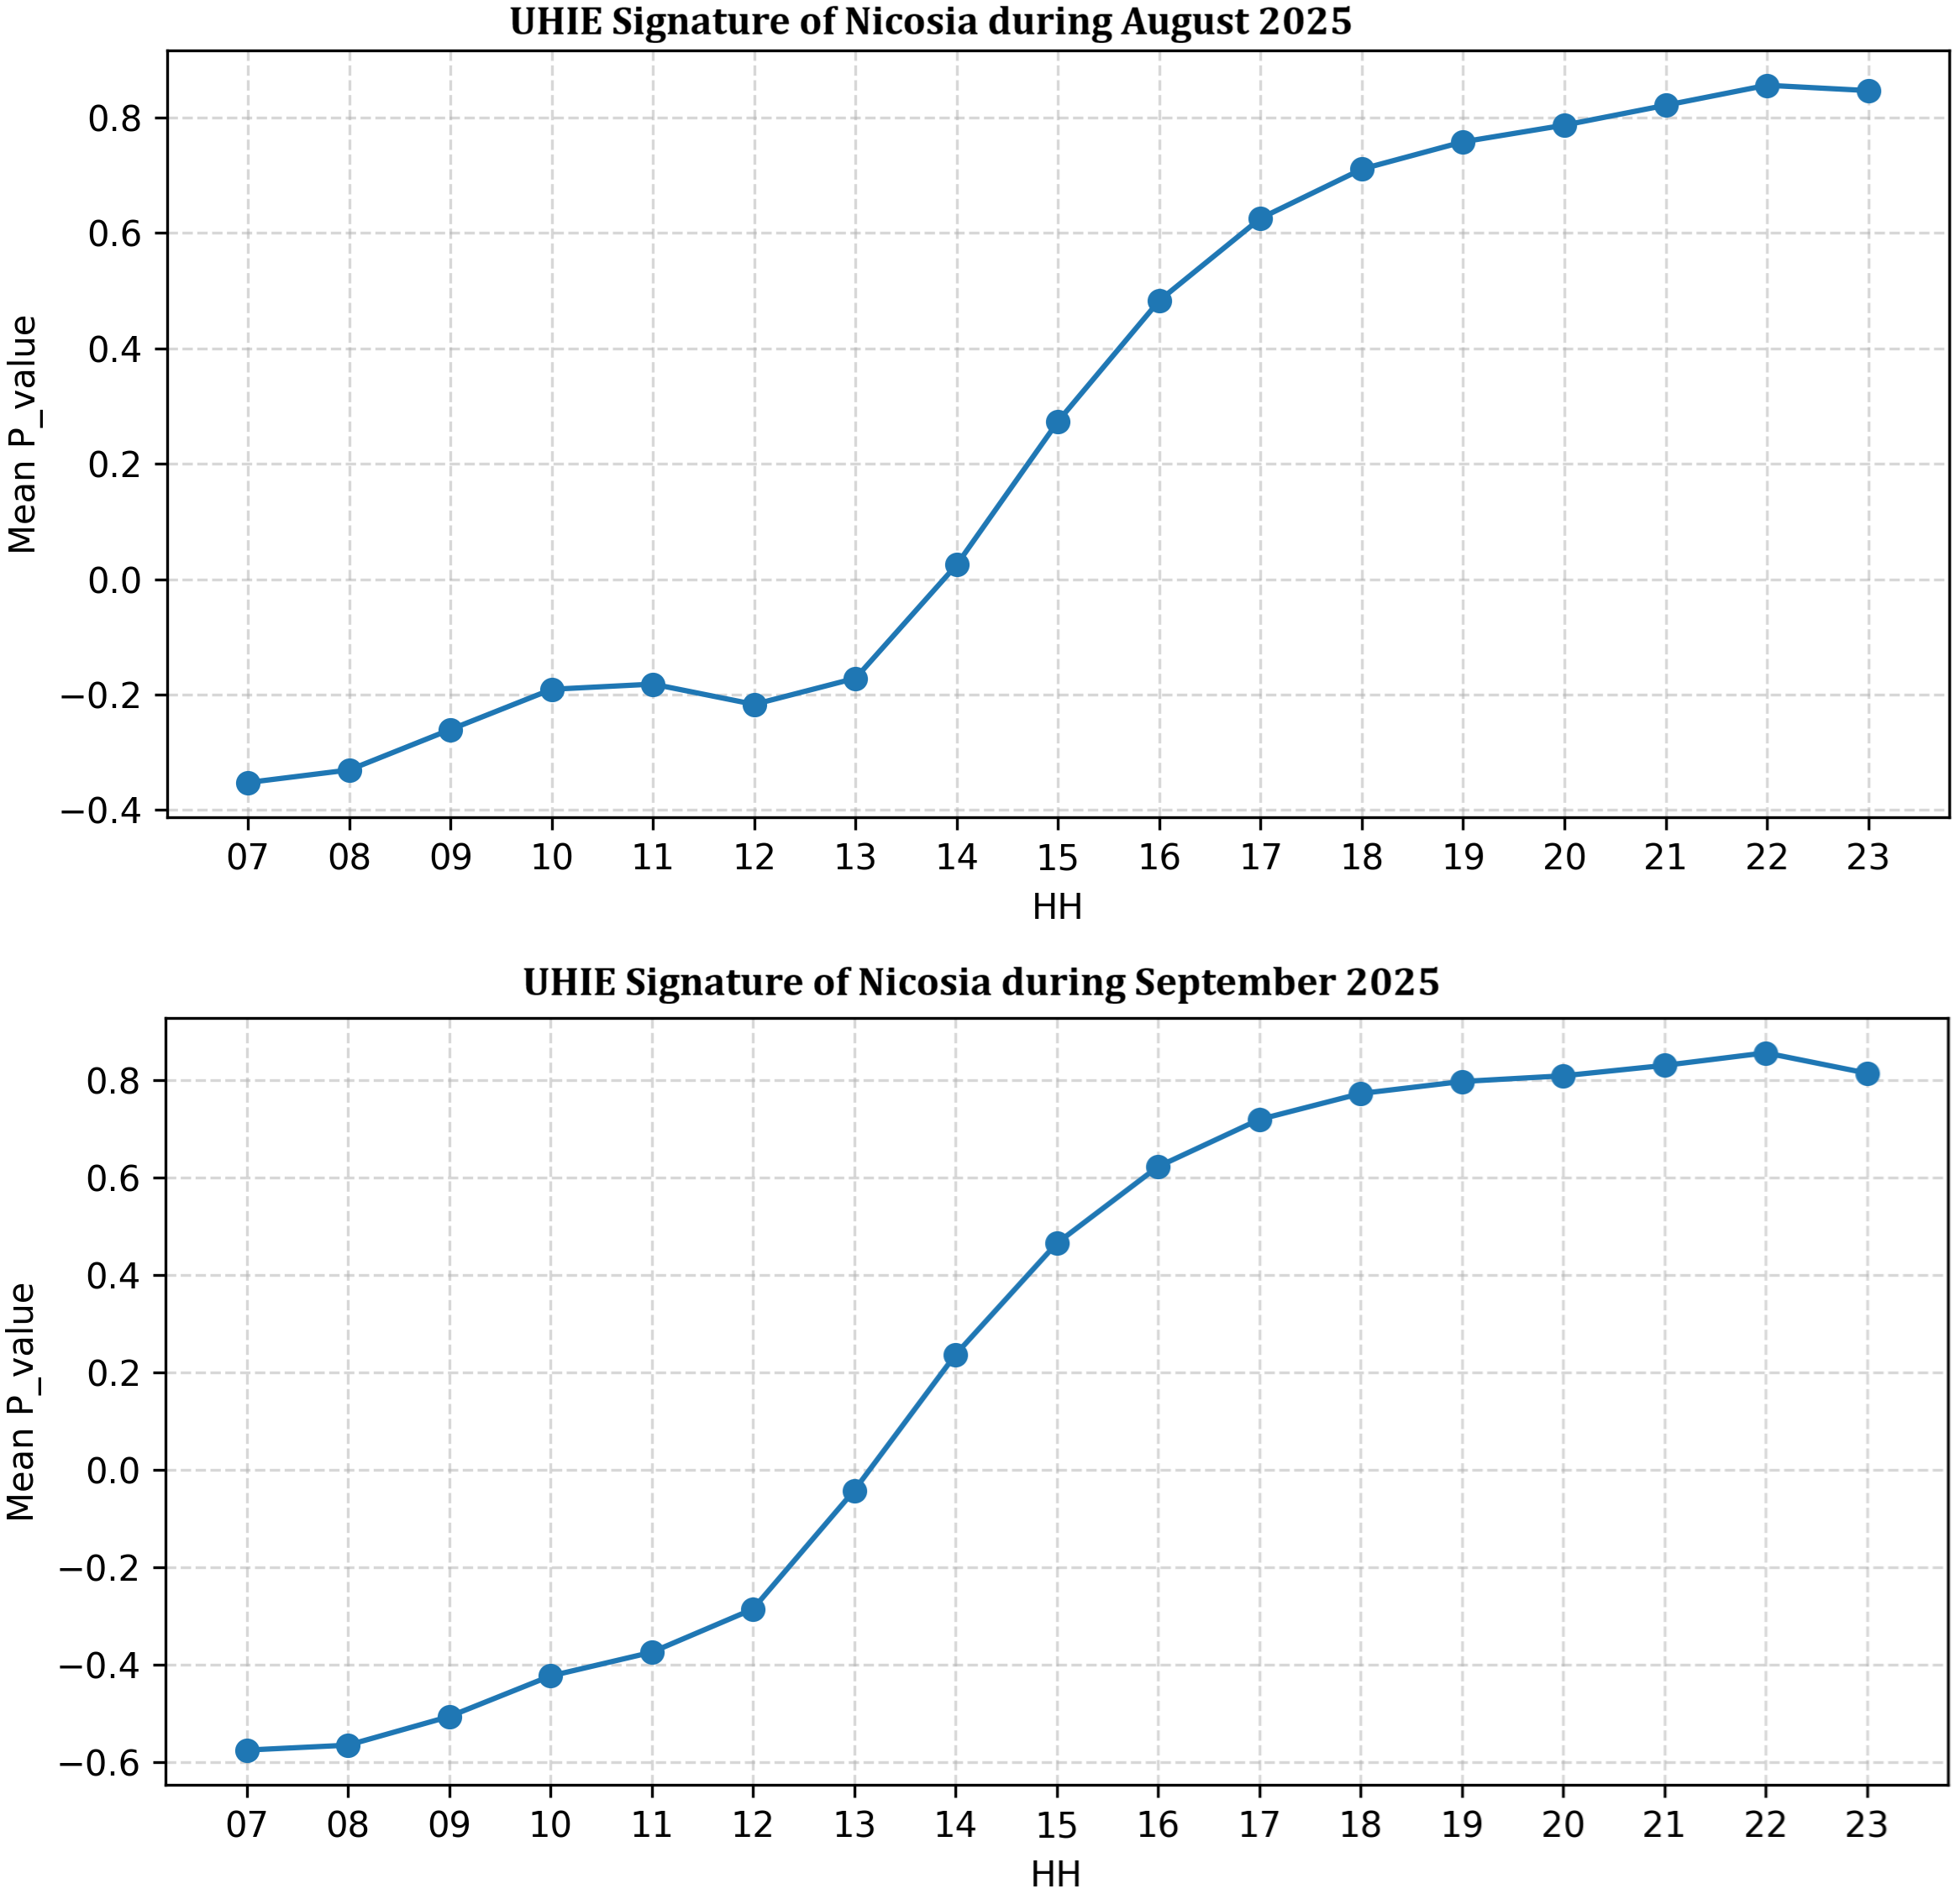
A key finding was that during the extreme heatwave of August 9–11, 2025 (>42°C), the urban–rural temperature difference nearly disappeared, as rural areas heated up equally. This suggests that highest heat stress does not always occur on the hottest days, but during moderately hot, windless conditions with accumulated heat. The coolest zones are mainly located near open spaces and along natural features, such as the Pedieos River, as well as in areas with increased tree cover. This highlights the important role of green spaces in urban environments. In contrast, the industrial zone of SOPAZ, where buildings are primarily metal structures combined with limited vegetation, exhibited a pronounced manifestation of the phenomenon. In general, areas characterized by dense concrete development and the use of heat-accumulating materials, together with reduced vegetation, clearly intensify this climatic effect.
The Validation: This study has significance only if we analyze the AI model's performance and overall precision. Our AI model basically predicts the (UHI), defined as the temperature difference between urban areas and the reference weather station at Athalassa, which is located outside the urban fabric. To validate our results, we used data from private weather stations located within the city and aggregate public data. Specifically, we relied on data from Weather Underground (WunderMap platform). We evaluated the quality of our AI model's predictions using the Mean Absolute Error (MAE) computed per weather station. Across the six stations, MAE was between 0.2471 and 1.0923°C, which is considered very low, demonstrating that our AI model offers state-of-the-art accuracy.
The Future: By identifying locations where heat is most intense, local authorities can better plan future interventions, such as increasing green spaces, improving shading, and implementing nature-based solutions. Specifically, the Municipality of Nicosia will use the results of the study to strategically enhance green coverage across the city, prioritizing areas identified as hotspots of the phenomenon. This aligns with the Mayor Mr. Prountzos’ announcement to plant 5,000 trees in the city. In the third and final phase of the CLIMAAX-NIC research project, further data collection is planned, along with the inclusion of citizens through a questionnaire. The main objective is to better understand their needs and document their experiences regarding private initiatives aimed at mitigating the phenomenon. These insights will guide future urban planning and climate adaptation efforts, with a focus on creating a more resilient, sustainable, and inclusive city for its residents.
Acknowledgments: Special thanks are extended to the Department of Meteorology for providing detailed temperature data from the Athalassa station during the summer period, especially to the Director Mr. Filippos Tymvios, for his invaluable support. Lots of thanks go also to the Technical Services (Mr. George Georgiou) and Mechanical Engineering Services (Mr. Menelaos Avraam) of the Municipality of Nicosia that supported the summer data collection routes and facilitated the integration of measurement devices into municipal vehicles.